Visualizations
A working set of data visualizations about India and Bengaluru, built from open public data. The story behind each one is in the captions; the data behind each one is linked at the bottom of the page.
-
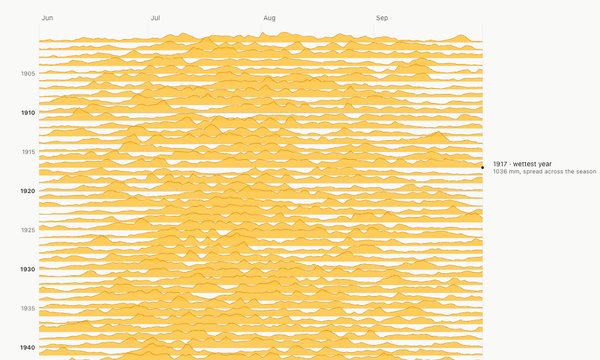
climate · 1901–2024
India's monsoon mood ring
Decades of daily gridded rainfall from IMD, stacked as ridges. Each year is a personality — bursty, broad, dry, late.
-
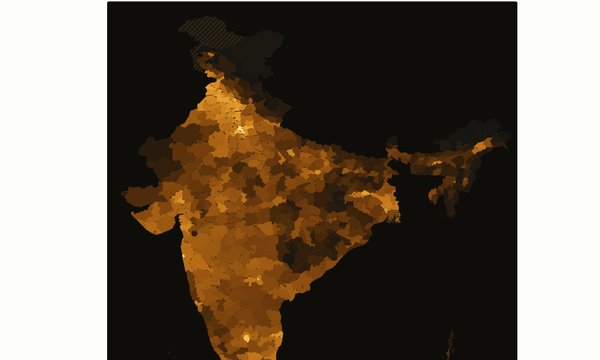
geography · 1994–2013
The night-lights frontier
DMSP satellite night-lights from SHRUG, 1994 → 2013. Watch India light up village by village, with a few pockets that didn't.
-
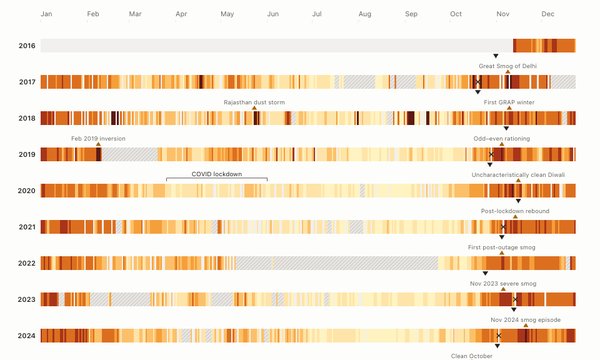
environment · 2016–2026
Delhi's air, every day for a decade
PM2.5 at the US Embassy monitor, 2016 to today. The winter spike, the lockdown drop, the post-COVID rebound — all on one screen.
-
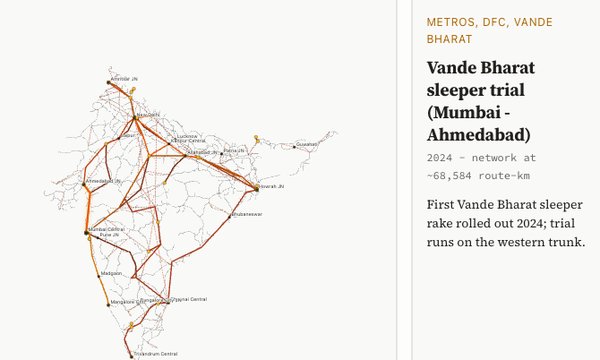
infrastructure · 1853–present
India by rail, century by century
The Datameet open railways network with thirteen historic corridors layered on year by year, from Bombay–Thane (1853) to Vande Bharat.
-
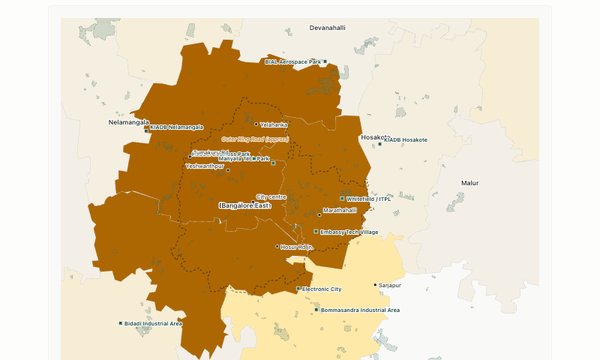
Bangalore · 1991–2011
Where Bangalore actually grew
Town-level population 1991 → 2011 around Bengaluru, with the BMTC trunk network overlaid. Growth ran where the buses did not.
-
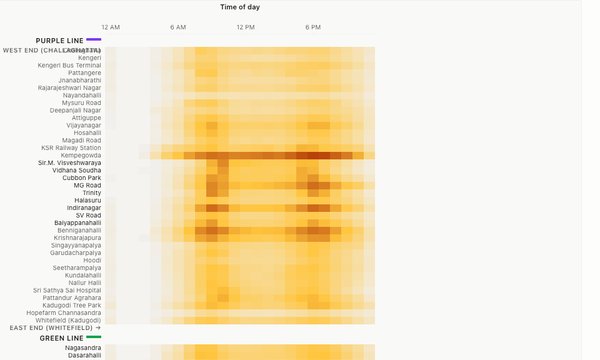
Bangalore · Sep 2025
A month on the Bangalore metro
BMRCL hourly station footfall in September 2025, every station, every hour. The Purple Line west-to-east, in motion.
-
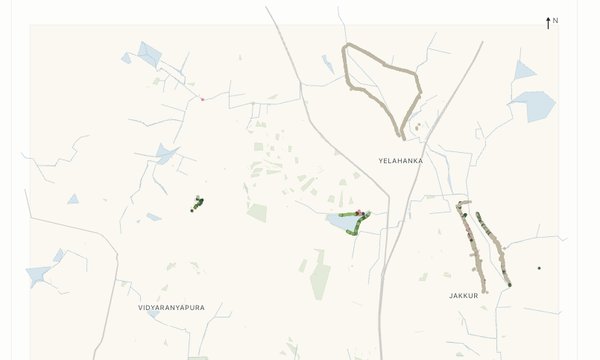
Bangalore · tree census
The trees of Yelahanka
BBMP's tree census for one zone of north Bengaluru. Ten thousand trees, one hundred species — most of them an Acacia.